Adobe Experience Platform Debugger Chrome Extension


-
Chrome Extension Page
-
Total Number of Extension users:70K +
-
Reviewed by :23 Chrome Users
-
Author Name:
-
['chrome-support@adobe.com', '345 Park Ave San Jose, CA 95110 US', 'True', 'Adobe Inc.', 'Adobe Inc.']
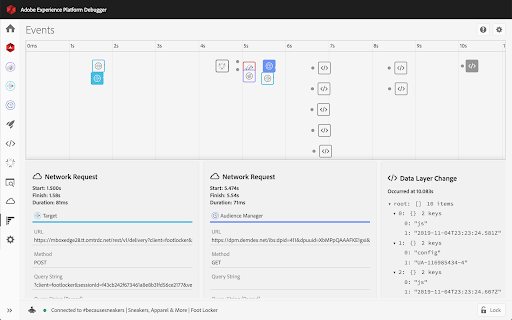
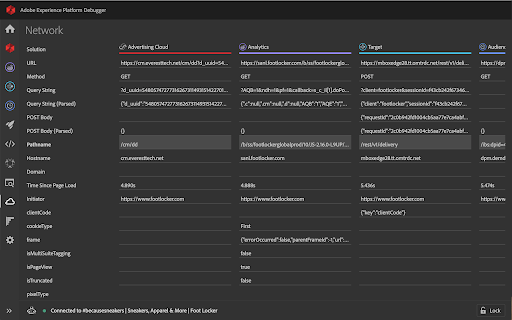
 The new Adobe Experience Platform Debugger helps to debug Adobe Experience Platform and Adobe Experience Cloud products. The new Debugger includes everything you love in the previous debugger plus these new features:

Fresh-yet-familiar design
Enjoy a debugging experience that feels more intuitive and natural.

More space to debug
The new navigation bar auto-collapses when Debugger get too small to ensure you have enough space to debug.

See your data layer in action
See data layer changes on a timeline alongside every Adobe network call to more easily debug your data.

Understand your data layer
Toggle the diff viewer to see how your data layer evolves across the event timeline.

Freely Flip through tabs
Click the Lock icon to stay connected to the current tab in focus without losing the context of the page you’re debugging.

Implementation health at your fingertips
See in-context implementation health checks powered by Adobe Experience Platform Auditor so ensure your Adobe implementations are healthy.

More flexible Launch and DTM testing
Inject Launch embed codes, or replace or block both DTM and Launch embed codes.

Easy on the eyes
Go to settings to toggle between dark- and light-mode.


How to install Adobe Experience Platform Debugger chrome extension in chrome Browser
You can Follow the below Step By Step procedure to install the Adobe Experience Platform Debugger Chrome Extension to your Chrome Web browser.
- Step 1: Go to the Chrome webstore https://chrome.google.com/webstore or download the extension Adobe Experience Platform Debugger Chrome Extension Download from https://pluginsaddonsextensions.com
- Step 2: Now search for the Adobe Experience Platform Debugger in Chrome Webstore Search and click on the search button.
- Step 3: click on the Adobe Experience Platform Debugger Chrome Extension Link
- Step 4: in the next page click on the Add to Chrome button to Download and Install the Adobe Experience Platform Debugger extension for your Chrome Web browser .
Adobe Experience Platform Debugger Chrome extension Download
Looking for a method to Adobe Experience Platform Debugger Download for Chrome then this download link is for you.It is the Adobe Experience Platform Debugger Chrome extension download link you can download and install Chrome Browser.
Download Adobe Experience Platform Debugger chrome extension (CRX)
-
Troubleshoot and audit analytics tags, variables and on-click events. Supports Adobe Analytics, Google Analytics, Ensighten and more
-
Enables the developer to locally override the embedded Launch or DTM library for testing.
-
MiaProva facilitates organizational scale and visibility into optimization programs. This extension is for Adobe Target end users.
-
Tagtician is an Adobe Launch/DTM debugger. Export and view entire TMS libraries in a simple, consolidated view.
-
Debug and test tag management (Google Tag Manager, DTM, Tealium) and analytics implementations.
-
Bookmarks to Adobe Experience Cloud: Analytics, AEP Data Collection Tags (formerly Launch), Target, Campaign, AEM and other products
-
View 'key' site metrics in an intuitive visual format.
-
Prints to JavaScript console what data is sent to Adobe Analytics.
-
AEM Chrome Extension for AEM Content Authors, Developers, and CMS Admins for the AEM platform, all versions of AEM + AEMaaaCS.
-
The Visual Editing Helper extension allows users to load their website into Adobe Target or Adobe Journey Optimizer.