Backbone Debugger Chrome Extension


-
Chrome Extension Page
-
Total Number of Extension users:4K +
-
Reviewed by :59 Chrome Users
-
Author Name:
-
['mh025r0x@gmail.com', 'True', 'Maluen']
Backbone Debugger chrome extension is Developer Tools extension for debugging Backbone.js applications..


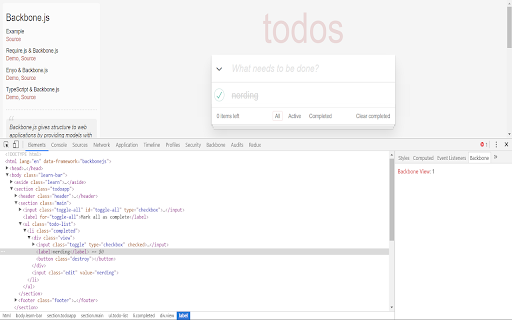

 Adds a panel under the Chrome Developer Tools that displays in real-time all your application views, models, collections and routers.

Data displayed includes:
- Views: rendering status, html element, associated model and/or collection, handled page events, events triggered
- Models: last sync status, attributes, id, cid, url, associated collection, events triggered, sync actions
- Collections: last sync status, models, url, events triggered, sync actions
- Routers: events triggered (include routes)

Extends the sidebar of the developer tools 'Elements' panel to display the Backbone View of the inspected html element.

========================

See the full list of changes and previous releases on https://github.com/Maluen/Backbone-Debugger/releases
How to install Backbone Debugger chrome extension in chrome Browser
You can Follow the below Step By Step procedure to install the Backbone Debugger Chrome Extension to your Chrome Web browser.
- Step 1: Go to the Chrome webstore https://chrome.google.com/webstore or download the extension Backbone Debugger Chrome Extension Download from https://pluginsaddonsextensions.com
- Step 2: Now search for the Backbone Debugger in Chrome Webstore Search and click on the search button.
- Step 3: click on the Backbone Debugger Chrome Extension Link
- Step 4: in the next page click on the Add to Chrome button to Download and Install the Backbone Debugger extension for your Chrome Web browser .
Backbone Debugger Chrome extension Download
Looking for a method to Backbone Debugger Download for Chrome then this download link is for you.It is the Backbone Debugger Chrome extension download link you can download and install Chrome Browser.
Download Backbone Debugger chrome extension (CRX)
-
Redux DevTools for debugging application's state changes.
-
Tool for debugging Ember applications.
-
Adds React debugging tools to the Chrome Developer Tools. Created from revision 47cf347e4 on 3/8/2024.
-
Chrome Developer Tools extension for debugging SolidJS applications.