FortiManager/FortiAnalyzer Debugger Chrome Extension

-
Chrome Extension Page
-
Total Number of Extension users:3K +
-
Reviewed by :6 Chrome Users
-
Author Name:
-
['fortinet-chrome-extensions@fortinet.com', '899 Kifer Rd Sunnyvale, CA 94086-5205 US', 'True', 'Fortinet', 'Fortinet Inc', 'Fortinet Inc']
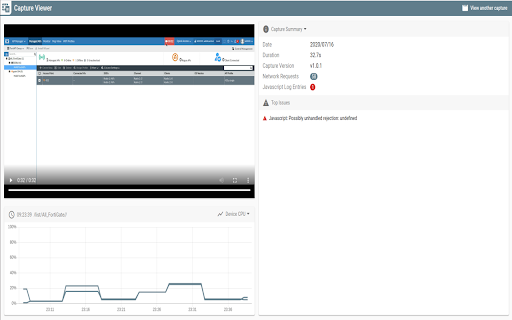
 This extension allows for capturing detailed debug information of a FortiManager/FortiAnalyzers graphical user interface. Requires FortiManager/FortiAnalyzer 6.4.0 GA or greater.

How to use this tool:

1. For capturing:
  a. Login to any FortiManager/FortiAnalyzer that is later than 6.4.0 GA, this extension color will turn blue (activated).
  b. Click this extension and select 'New Capture'
  c. update the file name and select 'Start Capture'
  d. FortiManager/FortiAnalyzer should prompt for permission, select 'OK' to start capturing debug information.
  e. A red record icon appears in the FortiManager/FortiAnalyzer toolbar.
  f. After finishing your operation, click the record icon to stop and download the captured zip file.

2. For viewing:
  a. Open this extension and select 'View Existing Capture'.
  b. Open the captured zip file in the newly opened viewer tab.
  c. Start the video to view the operation and different captured information.
How to install FortiManager/FortiAnalyzer Debugger chrome extension in chrome Browser
You can Follow the below Step By Step procedure to install the FortiManager/FortiAnalyzer Debugger Chrome Extension to your Chrome Web browser.
- Step 1: Go to the Chrome webstore https://chrome.google.com/webstore or download the extension FortiManager/FortiAnalyzer Debugger Chrome Extension Download from https://pluginsaddonsextensions.com
- Step 2: Now search for the FortiManager/FortiAnalyzer Debugger in Chrome Webstore Search and click on the search button.
- Step 3: click on the FortiManager/FortiAnalyzer Debugger Chrome Extension Link
- Step 4: in the next page click on the Add to Chrome button to Download and Install the FortiManager/FortiAnalyzer Debugger extension for your Chrome Web browser .
FortiManager/FortiAnalyzer Debugger Chrome extension Download
Looking for a method to FortiManager/FortiAnalyzer Debugger Download for Chrome then this download link is for you.It is the FortiManager/FortiAnalyzer Debugger Chrome extension download link you can download and install Chrome Browser.
Download FortiManager/FortiAnalyzer Debugger chrome extension (CRX)
-
Extends the Developer Tools, adding support for SAML Requests and Responses to be displayed in the Developer Tools window
-
Track all your learning.
-
The Shodan plugin tells you where the website is hosted (country, city), who owns the IP and what other services/ ports are open.
-
Clipboard helper for Secret Server
-
Support utility tool for capturing information from a FortiGate
-
Quick access to IP, DNS & Network Tools. Check DNS, Whois, ASN, Traceroute, Ping and more. Tools for technical operators.
-
Collects and displays SAML messages
-
PANW extension for Chrome
-
A chrome developer tools extension for viewing SAML messages in chrome