Lavaca Developer Tools Chrome Extension


-
Chrome Extension Page
-
Total Number of Extension users:131 +
-
Reviewed by :0 Chrome Users
-
Author Name:
-
['True', 'georgehendersonmusic']
Lavaca Developer Tools chrome extension is Chrome DevTools extension for debugging Lavaca apps..
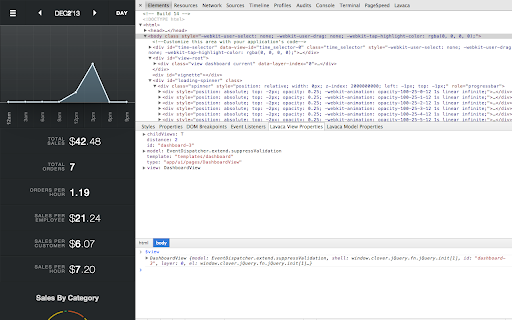


 Lavaca DevTools is an extension for debugging Lavaca apps. It allows you to easily:

- Visualize your applications view hierarchy and inspect the models associated with the rendered views.
- View the data associated with the defined routes for your application. Including the pattern, controller type, controller action, and additional parameters.
- Get the current view and model in the selected elements scope, defaulting to the view on the highest layer.

Lavaca DevTools also exposes two variables to the console.

$view - The current view in the selected elements scope. Defaults to the view on the highest layer.
$model - The current views model in the selected elements scope. Defaults to the model of the view on the highest layer.
How to install Lavaca Developer Tools chrome extension in chrome Browser
You can Follow the below Step By Step procedure to install the Lavaca Developer Tools Chrome Extension to your Chrome Web browser.
- Step 1: Go to the Chrome webstore https://chrome.google.com/webstore or download the extension Lavaca Developer Tools Chrome Extension Download from https://pluginsaddonsextensions.com
- Step 2: Now search for the Lavaca Developer Tools in Chrome Webstore Search and click on the search button.
- Step 3: click on the Lavaca Developer Tools Chrome Extension Link
- Step 4: in the next page click on the Add to Chrome button to Download and Install the Lavaca Developer Tools extension for your Chrome Web browser .
Lavaca Developer Tools Chrome extension Download
Looking for a method to Lavaca Developer Tools Download for Chrome then this download link is for you.It is the Lavaca Developer Tools Chrome extension download link you can download and install Chrome Browser.
Download Lavaca Developer Tools chrome extension (CRX)
-
Adds debugging tools for Preact to Chrome
-
Chrome extension to generate Laravel integration tests while using your app.
-
Chrome and Firefox DevTools extension for debugging Livewire applications.
-
Adds React debugging tools to the Chrome Developer Tools. Created from revision 47cf347e4 on 3/8/2024.
-
Chrome Developer Tools extension for debugging SolidJS applications.