Zabbix Notifier Chrome Extension


-
Chrome Extension Page
-
Total Number of Extension users:1K +
-
Reviewed by :38 Chrome Users
-
Author Name:
-
['True', 'gigatec GmbH']
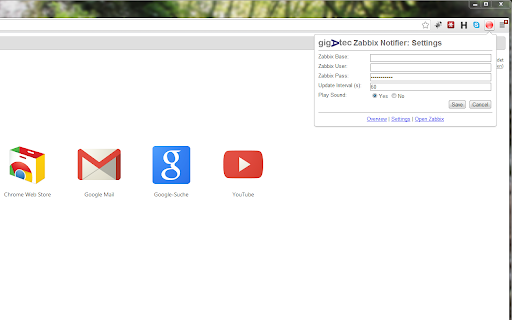
 Funktionen:
Mit dieser Erweiterung werden aktuelle Statusmeldungen des Zabbix Monitoring-Systems direkt im Browser angezeigt. Störungen und Probleme werden so schnell und zuverlässig erkannt.
Auch eine Soundbenachrichtigung ist konfigurierbar.
Durch die sich ändernde Farbe des Icons in der Stautsleiste des Browsers ist auf einen Blick ein Überblick über die überwachten Systeme und Dienste möglich.

Details:
- Getestet mit Zabbix 2.0.x
- Nutzt die Zabbix-API
- User-Name, Passwort, URL, Port und Updateintervall sind konfigurierbar

ChangeLog:
1.1.3 - Behebt Login-Probleme in Verbindung mit Zabbix 2.0.4
1.2   - Bugfixes (Update-Problems), Number of Problems is displayed in the icon
1.3   - Bugfix (Wrong icon when there are no notifications)
1.4   - Dependency Checking (skipDependent: 1)
1.5   - Hide Acknowledged Events (config.hideAck: true) & Reactivate Simple Notification Popup
1.6   - Bugfix Zabbix 2.4 Authentication
1.6.1 - Add feature filter by group
1.7   - Add support for zabbix 3.4, display the System Name

GitHub Projekt:
https://github.com/gigatec/zabbixnotifier
How to install Zabbix Notifier chrome extension in chrome Browser
You can Follow the below Step By Step procedure to install the Zabbix Notifier Chrome Extension to your Chrome Web browser.
- Step 1: Go to the Chrome webstore https://chrome.google.com/webstore or download the extension Zabbix Notifier Chrome Extension Download from https://pluginsaddonsextensions.com
- Step 2: Now search for the Zabbix Notifier in Chrome Webstore Search and click on the search button.
- Step 3: click on the Zabbix Notifier Chrome Extension Link
- Step 4: in the next page click on the Add to Chrome button to Download and Install the Zabbix Notifier extension for your Chrome Web browser .
Zabbix Notifier Chrome extension Download
Looking for a method to Zabbix Notifier Download for Chrome then this download link is for you.It is the Zabbix Notifier Chrome extension download link you can download and install Chrome Browser.
Download Zabbix Notifier chrome extension (CRX)
-
The Ultimate online investigation tool! See detailed information about every IP Address, Domain Name and Provider.
-
Form filler that obtains entries from Remote Desktop Manager, Devolutions Server and Devolutions Hub Business / Personal
-
Passbolt extension for the open source password manager for teams.
-
Monitor Zabbix problems from your browser
-
Automatically rotate through open tabs. By Ben Hedrington
-
Simple script which places the IP of the current website in the bottom right.
-
Display the server IP address, with a realtime summary of IPv4, IPv6, and HTTPS information across all page elements.
-
Icinga Multi Status helps you monitor your Icinga instances with alert badges and notifications about incidents.