Web Vitals Chrome Extension


-
Chrome Extension Page
-
Total Number of Extension users:100K +
-
Reviewed by :40 Chrome Users
-
Author Name:
-
['addyosmani@gmail.com', 'True', 'addyosmani']
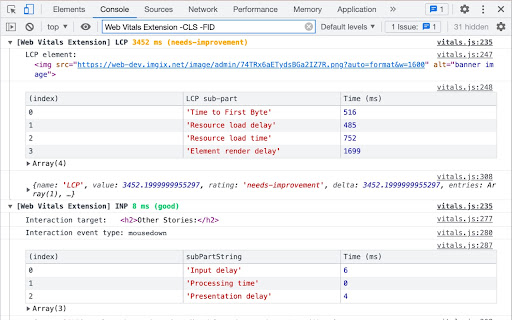
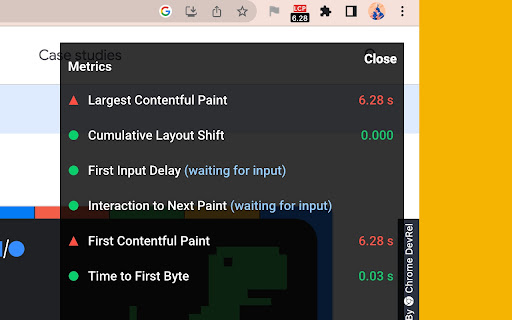
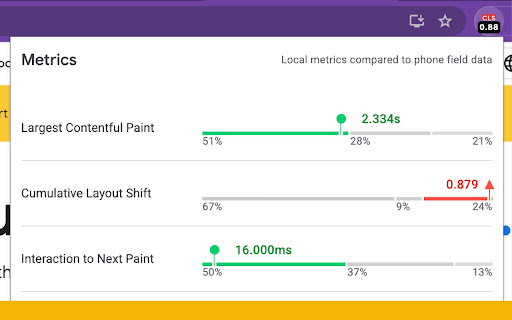
 Web Vitals are quality signals key to delivering great UX on the web (https://web.dev/vitals). This extension measures the Core Web Vitals, providing instant feedback on loading, interactivity and layout shift metrics. It is consistent with how these metrics are measured by Chrome and reported to other Google tools (e.g. Chrome User Experience Report, Page Speed Insights, Search Console).

The extension supports all of the Core Web Vitals and captures:

Largest Contentful Paint
Cumulative Layout Shift
Interaction to Next Paint

It also supports the diagnostic metrics:

Time to First Byte
First Contentful Paint

And finally, it temporarily supports the following deprecated metrics:

First Input Delay

The extension provides three core features:

1) Ambient Badge - This helps check if a page passing the Core Web Vitals thresholds.

Once installed, the extension will display a disabled state badge icon until you navigate to a URL. At this point it will update the badge to green or red depending on whether the URL passes the Core Web Vitals metrics thresholds.

The badge has a number of states:

* Disabled - gray
* Passing - green
* One or more metrics failing - red

If one or more metrics are failing, the badge will animate the values of these metrics.

2) Detailed drill-down in the popup

Clicking the Ambient badge icon will allow you to drill in to the individual metric values. In this mode, the extension will also say if a metric value might change or requires a user action.

For example, First Input Delay requires a real interaction (e.g click/tap) with the page and will be in a waiting for input state until this is the case. We recommend consulting the web.dev documentation for LCP, CLS and FID to get an understanding of when metric values settle.

As of version 1.0.0, the popup combines your local Core Web Vitals experiences with real-user data from the field via the Chrome UX Report (CrUX) API. This integration gives you contextual insights to help you understand how similar your individual experiences are to other desktop users on the same page. Weve also added a new option to 'Compare local experiences to phone field data' instead, if needed. Note that CrUX data may not be available for some pages, in which case we try to load field data for the origin as a whole.

3) HUD Overlay

The overlay displays a Heads up display (HUD) which overlays your page. It is useful if you need a persistent view of your Core Web Vitals metrics during development. To enable the overlay:

Right-click on the Ambient badge and go to Options.
Check Display HUD overlay and click Save
Reload the tab for the URL you wish to test. The overlay should now be present.

How to install Web Vitals chrome extension in chrome Browser
You can Follow the below Step By Step procedure to install the Web Vitals Chrome Extension to your Chrome Web browser.
- Step 1: Go to the Chrome webstore https://chrome.google.com/webstore or download the extension Web Vitals Chrome Extension Download from https://pluginsaddonsextensions.com
- Step 2: Now search for the Web Vitals in Chrome Webstore Search and click on the search button.
- Step 3: click on the Web Vitals Chrome Extension Link
- Step 4: in the next page click on the Add to Chrome button to Download and Install the Web Vitals extension for your Chrome Web browser .
Web Vitals Chrome extension Download
Looking for a method to Web Vitals Download for Chrome then this download link is for you.It is the Web Vitals Chrome extension download link you can download and install Chrome Browser.
Download Web Vitals chrome extension (CRX)
-
Automatically checks each page for AMP validation.
-
Shows SEO issues as you navigate pages. Displays performance data and full AMP status and errors for HTML pages.
-
This extension measures Google Core Web Vital Scores
-
View source is dead. See how the browser renders a page, not just what the server sends.
-
Easily build validated json-ld structured data markup for any webpage. Based on schema.org specification
-
Test and debug cumulative layout shifts (CLS) in the browser
-
Visualizer the CLS of any webpage
-
Prints useful information to the JavaScript console by enabling the debug version of the Google Analytics Javascript.
-
Displays all meta data and main SEO information for the best SEO
-
Show the Core Web Vitals data from the Chrome User Experience Report in the Google Search Results.