Chrome //
Extensions
Chrome //
Extensions  Chrome
Web store
Chrome
Web store Google Analytics Debugger Chrome Extension


-
Chrome Extension Page
-
Total Number of Extension users:600K +
-
Reviewed by :534 Chrome Users
-
Author Name:
-
['analytics-extensions@google.com', 'True', 'Google Analytics']
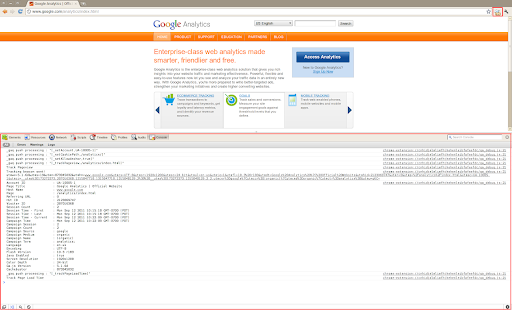
 This extension loads the debug version of the Google Analytics Javascript for all sites you browse using Google Chrome.  It prints useful information to the Javascript console.  These messages include error messages and warnings which can tell you when your analytics tracking code is set up incorrectly.  In addition, it provides a detailed breakdown of each tracking beacon sent to Google Analytics.

To use this extension, You need to follow three steps:

1. Turn it on by clicking its icon to the right of the address bar.
2. Open the Chrome Javascript console to see the messages.
        On Windows and Linux, press Control-Shift-J.
        On Mac, press Command-Option-J.
3. Refresh the page you are on.

By installing this extension, you agree to the Chrome Gallery Terms of Service at https://chrome.google.com/extensions/intl/en/gallery_tos.html

You can ask questions about the plugin and report bugs at analytics-extensions@google.com

New in this version:
- Added support for Universal Analytics.
- Fixed some bugs.

How to install Google Analytics Debugger chrome extension in chrome Browser
You can Follow the below Step By Step procedure to install the Google Analytics Debugger Chrome Extension to your Chrome Web browser.
- Step 1: Go to the Chrome webstore https://chrome.google.com/webstore or download the extension Google Analytics Debugger Chrome Extension Download from https://pluginsaddonsextensions.com
- Step 2: Now search for the Google Analytics Debugger in Chrome Webstore Search and click on the search button.
- Step 3: click on the Google Analytics Debugger Chrome Extension Link
- Step 4: in the next page click on the Add to Chrome button to Download and Install the Google Analytics Debugger extension for your Chrome Web browser .
Google Analytics Debugger Chrome extension Download
Looking for a method to Google Analytics Debugger Download for Chrome then this download link is for you.It is the Google Analytics Debugger Chrome extension download link you can download and install Chrome Browser.
Download Google Analytics Debugger chrome extension (CRX)
-
The easiest way to debug and check the dataLayer implementations without having to use the browser console!
-
The Page Analytics Chrome Extension allows you to see how customers interact with your web pages.
-
Debug and test tag management (Google Tag Manager, DTM, Tealium) and analytics implementations.
-
Your Single Source of Truth (SSOT) for debugging analytics implementations
-
A browser extension for debugging Google Analytics tracking code
-
The Tag Assistant Companion extension works with Tag Assistant to help troubleshoot installation of gtag.js and Google Tag Manager.
-
This extension is no longer supported.
-
DataLayer Tools for Digital Analysts
-
Digital analytics quality made easy
-
Plugin to track Google Analytics Event Tracker event calls