Angular BatScanner Chrome Extension


-
Chrome Extension Page
-
Total Number of Extension users:1K +
-
Reviewed by :9 Chrome Users
-
Author Name:
-
['douglasduteil']
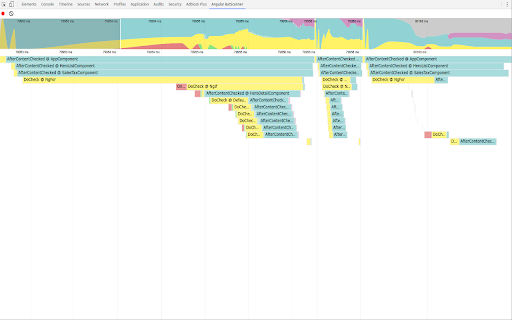
 Yet another Angular 2 devtool, Angular BatScanner is focus on performance analysis. Like debugging the performance bottleneck is hard. I made a tool to visualize what is happening for Angular when your application is running. Its similar to Timeline Tool but using the Angular Component vocabulary. By hooking into the components life cycle system we can quickly explore a record to answer :
- when, where and why a change happened
- how often its changed
- how much time a components took to react to it
- etc...
How to install Angular BatScanner chrome extension in chrome Browser
You can Follow the below Step By Step procedure to install the Angular BatScanner Chrome Extension to your Chrome Web browser.
- Step 1: Go to the Chrome webstore https://chrome.google.com/webstore or download the extension Angular BatScanner Chrome Extension Download from https://pluginsaddonsextensions.com
- Step 2: Now search for the Angular BatScanner in Chrome Webstore Search and click on the search button.
- Step 3: click on the Angular BatScanner Chrome Extension Link
- Step 4: in the next page click on the Add to Chrome button to Download and Install the Angular BatScanner extension for your Chrome Web browser .
Angular BatScanner Chrome extension Download
Looking for a method to Angular BatScanner Download for Chrome then this download link is for you.It is the Angular BatScanner Chrome extension download link you can download and install Chrome Browser.
Download Angular BatScanner chrome extension (CRX)
-
Angular DevTools extends Chrome DevTools adding Angular specific debugging and profiling capabilities.
-
Helps you in debugging AngularJS applications. Extends the elements panel in devtools to display scope properties.
-
Inspect the scope watchers of an Angular app
-
Angular context inspector
-
Basic AngularJS debugging in Chrome
-
Devtools panel to visualize rxjs observables
-
Add shortcuts to easily debug your Angular application.
-
Extends the Developer Tools, Panel for helping developers with AngularJS helpers.
-
Check how many watchers are active in an angular app
-
Detects AngularJS apps as you browse.