AngularJS Inspect Watchers Chrome Extension


-
Chrome Extension Page
-
Total Number of Extension users:4K +
-
Reviewed by :21 Chrome Users
-
Author Name:
-
['True', 'Ryan Oglesby']
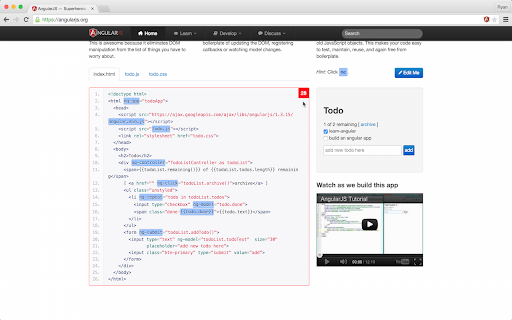
 A Chrome extension that lets the user inspect the number of Angular watchers that exist on any element of an Angular app.

***** 4/20/2015 Update!
I just released v1.0.0 of the extension, which moves the extension from a Browser Action to a Page Action (icon appears in the address bar). A Page Action is more appropriate for this extension because the features only makes sense for a few web pages, those with AngularJS running.

Usage:
Once installed, navigate to your Angular app and click the Page Action in the address bar to activate the extension. Then, hover your mouse over different sections of your Angular application to see the scopes and watchers highlighted in red. Click the Page Action again to deactivate.

Motivation:
It is a well known fact that as the number of watchers in an Angular app increases, the digest cycle performance decreases. In Angular 1.3, anything over 2,000 watchers will dramatically effect performance. This extension can help you easily monitor the number of watchers you are adding.

Troubleshooting
I dont see the Page Action! What do I do? --> Ng Inspect Watchers can only be used on AngularJS apps that have debug info enabled. If you navigate to any web page that is either not an AngularJS app, or does not have debug info enabled, you will not be able to use the extension.

How do I enable debug info? --> The extension relies on the presence of `.ng-scope` and `.ng-isolate-scope` CSS class names. If you have run `$compileProvider.debugInfoEnabled(false);` on your app, it wont work. To get the classes back, you can run `angular.reloadWithDebugInfo();` in the console and try again. See https://docs.angularjs.org/guide/production#disabling-debug-data for more info.

How to install AngularJS Inspect Watchers chrome extension in chrome Browser
You can Follow the below Step By Step procedure to install the AngularJS Inspect Watchers Chrome Extension to your Chrome Web browser.
- Step 1: Go to the Chrome webstore https://chrome.google.com/webstore or download the extension AngularJS Inspect Watchers Chrome Extension Download from https://pluginsaddonsextensions.com
- Step 2: Now search for the AngularJS Inspect Watchers in Chrome Webstore Search and click on the search button.
- Step 3: click on the AngularJS Inspect Watchers Chrome Extension Link
- Step 4: in the next page click on the Add to Chrome button to Download and Install the AngularJS Inspect Watchers extension for your Chrome Web browser .
AngularJS Inspect Watchers Chrome extension Download
Looking for a method to AngularJS Inspect Watchers Download for Chrome then this download link is for you.It is the AngularJS Inspect Watchers Chrome extension download link you can download and install Chrome Browser.
Download AngularJS Inspect Watchers chrome extension (CRX)
-
AngularJS dependency graph.
-
Angular DevTools extends Chrome DevTools adding Angular specific debugging and profiling capabilities.
-
Helps you in debugging AngularJS applications. Extends the elements panel in devtools to display scope properties.
-
Capture requests from any website and send them to Postman Client.
-
Angular 2 BatScanner extension
-
Detect Angular apps and javascript libraries
-
Angular context inspector
-
Extends the Developer Tools, Panel for helping developers with AngularJS helpers.
-
Check how many watchers are active in an angular app
-
Helps you debug Angular component state. Supports Angular 1/2+/Ivy!