Catberry Debugger Chrome Extension


-
Chrome Extension Page
-
Total Number of Extension users:143 +
-
Reviewed by :4 Chrome Users
-
Author Name:
-
[]
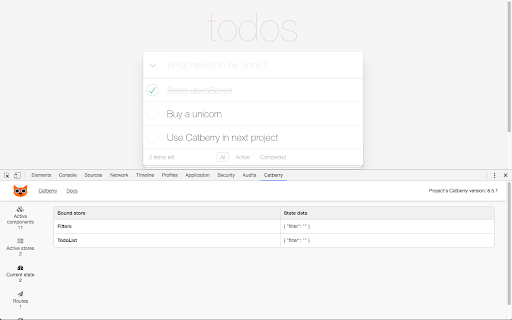
 Catberry Debugger extends Chrome Developer Tools:
* adds a sidebar that displays information about Catberry-component associated with the selected DOM element;
* adds a panel that displays components, routes, stores data, the state and statistics.
More about Catberry framework http://catberry.org/


How to install Catberry Debugger chrome extension in chrome Browser
You can Follow the below Step By Step procedure to install the Catberry Debugger Chrome Extension to your Chrome Web browser.
- Step 1: Go to the Chrome webstore https://chrome.google.com/webstore or download the extension Catberry Debugger Chrome Extension Download from https://pluginsaddonsextensions.com
- Step 2: Now search for the Catberry Debugger in Chrome Webstore Search and click on the search button.
- Step 3: click on the Catberry Debugger Chrome Extension Link
- Step 4: in the next page click on the Add to Chrome button to Download and Install the Catberry Debugger extension for your Chrome Web browser .
Catberry Debugger Chrome extension Download
Looking for a method to Catberry Debugger Download for Chrome then this download link is for you.It is the Catberry Debugger Chrome extension download link you can download and install Chrome Browser.
Download Catberry Debugger chrome extension (CRX)
-
Adds console.sparkline to all web pages and Chrome Devtools.
-
Adds an 'Open as...' context menu with configurable actions: search, open on an API, 100% scriptable (via CoffeeScript).
-
Chrome DevTools extension for debugging Lavaca apps.
-
Development Tool to develop, inspect and debug Atma.js Components
-
Output Keen IO analytics data in the JavaScript console
-
Extension for the Developer Tools to display the properties of an associated The-M-Project object.
-
Show user details and repository info in a tooltip.
-
Adds a confirmation dialog to the Github and Gist Fork button.
-
Hyperlinks submodule 'hash'es and submodule diffs on GitHub.