First Paint & Page Load Time Chrome Extension


-
Chrome Extension Page
-
Total Number of Extension users:4K +
-
Reviewed by :14 Chrome Users
-
Author Name:
-
['vijaysutrave01@gmail.com', 'True', 'Vijay Sutrave']
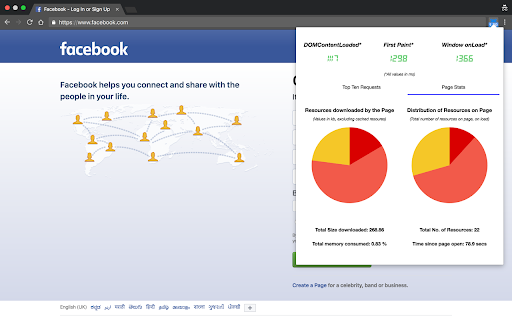
 Displays the First Paint time in the browser menu.

Now you can see page stats like the top ten time consuming requests on the page, the distribution of resources on the page, and other stats like memory, etc, illustrated with pretty looking graphs.

Source Code available at :
https://github.com/vijaysutrave/chrome-first-paint

This can give you insights in reducing your load times and optimising for quicker render times.

This extension uses the Resource Timing API and the Performance API in the browser.

How to install First Paint & Page Load Time chrome extension in chrome Browser
You can Follow the below Step By Step procedure to install the First Paint & Page Load Time Chrome Extension to your Chrome Web browser.
- Step 1: Go to the Chrome webstore https://chrome.google.com/webstore or download the extension First Paint & Page Load Time Chrome Extension Download from https://pluginsaddonsextensions.com
- Step 2: Now search for the First Paint & Page Load Time in Chrome Webstore Search and click on the search button.
- Step 3: click on the First Paint & Page Load Time Chrome Extension Link
- Step 4: in the next page click on the Add to Chrome button to Download and Install the First Paint & Page Load Time extension for your Chrome Web browser .
First Paint & Page Load Time Chrome extension Download
Looking for a method to First Paint & Page Load Time Download for Chrome then this download link is for you.It is the First Paint & Page Load Time Chrome extension download link you can download and install Chrome Browser.
Download First Paint & Page Load Time chrome extension (CRX)
-
Performance Toolkit for Chrome Devtools. A visualization of the performance timing.
-
Displays page load time in the toolbar
-
Analyze the performance of your webpages and get specific suggestions on how to optimize them.
-
Reports page size, cache usage, network requests, load time.
-
Get insight into the performance of the website in the current tab - sort of a mini live version of WebPageTest
-
Page Load Times
-
Shows the response times of up to three webservers. Useful to see how the internet/server connection performs.
-
Get a notification when a page finishes loading.
-
Simple site performance bar that presents network, server, client and pageload times
-
Shows a sitespeed report for the current page you are on. Includes TTFB , redirect time, request time , response time and much more.