Simple Performance Bar Chrome Extension


-
Chrome Extension Page
-
Total Number of Extension users:277 +
-
Reviewed by :6 Chrome Users
-
Author Name:
-
['True', 'Oliver Tse']
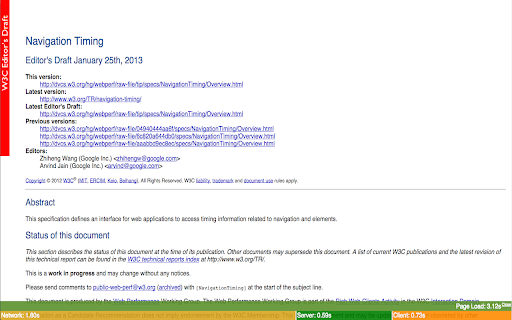
 Using the Navigation Timing API, the Simple Performance Bar presents network, server, client and page load times as a group of easy to read bars fixed to the bottom of your browser.  Each time your page loads, the Simple Performance Bar appears.

Network, server and client time calculations are found in the W3C Navigation Timing Draft ( https://dvcs.w3.org/hg/webperf/raw-file/tip/specs/NavigationTiming/Overview.html ). Network time is connectEnd minus navigationStart.  Server time is responseEnd minus connectEnd.  Finally, client time is loadEventEnd minus responseEnd.

How to install Simple Performance Bar chrome extension in chrome Browser
You can Follow the below Step By Step procedure to install the Simple Performance Bar Chrome Extension to your Chrome Web browser.
- Step 1: Go to the Chrome webstore https://chrome.google.com/webstore or download the extension Simple Performance Bar Chrome Extension Download from https://pluginsaddonsextensions.com
- Step 2: Now search for the Simple Performance Bar in Chrome Webstore Search and click on the search button.
- Step 3: click on the Simple Performance Bar Chrome Extension Link
- Step 4: in the next page click on the Add to Chrome button to Download and Install the Simple Performance Bar extension for your Chrome Web browser .
Simple Performance Bar Chrome extension Download
Looking for a method to Simple Performance Bar Download for Chrome then this download link is for you.It is the Simple Performance Bar Chrome extension download link you can download and install Chrome Browser.
Download Simple Performance Bar chrome extension (CRX)
-
Displays page load time in the toolbar
-
Ember.js app performance tool. See on page, console, and devtools timeline where performance bottlenecks are. Developed by LinkedIn.
-
Dev Helper
-
Page Load Times
-
Shows the response times of up to three webservers. Useful to see how the internet/server connection performs.
-
This extensions displays some technical and structural performance data of websites.
-
Get a notification when a page finishes loading.
-
This extension launches WebPageTest for the current page
-
Infometer helps you measure how much of a web page you have read.
-
Manage - and group - your installed extensions