Piwik PRO - Site inspector Chrome Extension


-
Chrome Extension Page
-
Total Number of Extension users:3K +
-
Reviewed by :2 Chrome Users
-
Author Name:
-
['site-inspector@piwik.pro', 'Świętego Antoniego 2 4 Wrocław 50-043 PL', 'True', 'True', 'Piwik PRO', 'Piwik PRO', 'Piwik PRO']
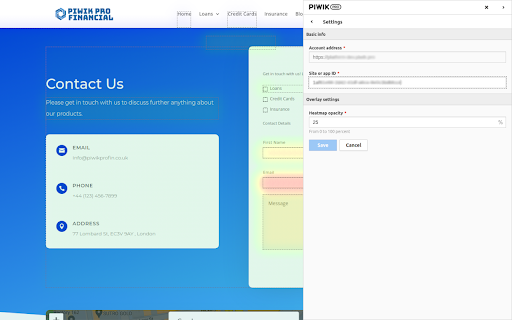
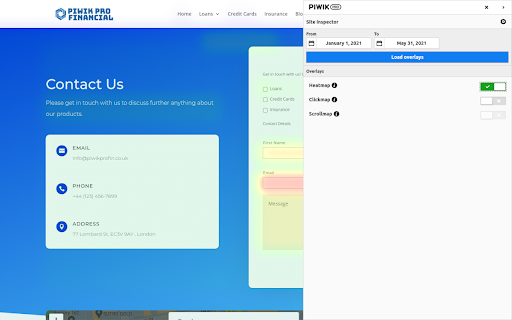
 Extension connects with Piwik PRO instance to visualize tracked data on the page. It supports visualization of clicks (heatmap or tooltips with numerical data), page scrolling information and debugging panel showing tracking requests sent from page.

Requirements:
* To access any data you have to own an account in a Piwik PRO instance.
* Piwik PRO instance has to be configured to gather heatmap events (clicks or scrolling).

To use this extension, You need to follow these steps:
* Click on extension button to open side panel
* Login to Piwik PRO instance in side panel
* Enable visualisation that You want to show

Complete setup is described here: https://help.piwik.pro/support/analytics-new/site-inspector/

You can ask questions about the plugin and report bugs at site-inspector@piwik.pro


How to install Piwik PRO - Site inspector chrome extension in chrome Browser
You can Follow the below Step By Step procedure to install the Piwik PRO - Site inspector Chrome Extension to your Chrome Web browser.
- Step 1: Go to the Chrome webstore https://chrome.google.com/webstore or download the extension Piwik PRO - Site inspector Chrome Extension Download from https://pluginsaddonsextensions.com
- Step 2: Now search for the Piwik PRO - Site inspector in Chrome Webstore Search and click on the search button.
- Step 3: click on the Piwik PRO - Site inspector Chrome Extension Link
- Step 4: in the next page click on the Add to Chrome button to Download and Install the Piwik PRO - Site inspector extension for your Chrome Web browser .
Piwik PRO - Site inspector Chrome extension Download
Looking for a method to Piwik PRO - Site inspector Download for Chrome then this download link is for you.It is the Piwik PRO - Site inspector Chrome extension download link you can download and install Chrome Browser.
Download Piwik PRO - Site inspector chrome extension (CRX)
-
Troubleshoot and audit analytics tags, variables and on-click events. Supports Adobe Analytics, Google Analytics, Ensighten and more
-
From Chrome Developer Console, highlight elements to get JavaScript code. Built by: Triangle Digital (Triangledigital.xyz)
-
Digital analytics quality made easy
-
The Supermetrics Google Marketing Platform power tools for smart digital marketers and analysts.
-
The easiest way to debug and check the dataLayer implementations without having to use the browser console!
-
Debug and test tag management (Google Tag Manager, DTM, Tealium) and analytics implementations.
-
Prints useful information to the JavaScript console by enabling the debug version of the Google Analytics Javascript.
-
Omnibug is a browser extension to decode and display outgoing digital marketing tool requests.
-
A browser extension for debugging Google Analytics tracking code
-
Your Single Source of Truth (SSOT) for debugging analytics implementations