Perforator - Ember Performance Extension Chrome Extension


-
Chrome Extension Page
-
Total Number of Extension users:269 +
-
Reviewed by :7 Chrome Users
-
Author Name:
-
['edelman.jason@gmail.com', 'True', 'Edelman']
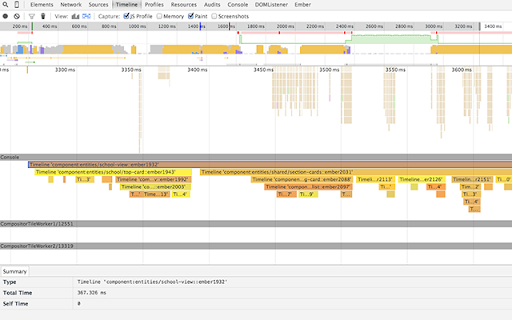
 NOTE: Your Chrome version must be at least 44 (for ES6 support) and your Ember version must be at least 1.10 (for components).

KNOWN ISSUE: Time tags occasionally wont show up if you load your Ember asynchronously. Im working on it, but you should be able tp navigate to another route if youd like to see them.

Perforator will help you determine your Ember.js apps performance bottlenecks. When activated, Perforator will time the rendering time of your Ember components and give you several ways to dig in to investigate individual components.

Main features include:

- In-page overlay of the render time for your components, colorized by relative speed. See at a glance what is taking so long! Hovering the tabs shows the components classes and ember IDs. Clicking on the tag scootches it a bit :)
- Sortable table of useful rendering stats and information inside your dev tools console.
- A visual hierarchy of components as they are rendered inside the 'Timeline' tab in your dev tools (scroll down to the 'console' row label inside the 'Timeline' tab).

The browser icon and popup provide some useful information as well:

- Icon is colorized when Ember is present on the page, grayscale otherwise.
- When Ember is present, clicking the browser icon pulls up a popup window that will allow you to turn Perforator on and off (for when you arent doing performance tuning!), *which will refresh the page*
- Popup has a button for you to toggle the visible state of the timer tags on the in-page overlay.

No personal information is required or harvested, and no calls are made to a remote server (check the code!). No reliance on jQuery or any framework other than Ember.

Proudly developed at LinkedIn!
How to install Perforator - Ember Performance Extension chrome extension in chrome Browser
You can Follow the below Step By Step procedure to install the Perforator - Ember Performance Extension Chrome Extension to your Chrome Web browser.
- Step 1: Go to the Chrome webstore https://chrome.google.com/webstore or download the extension Perforator - Ember Performance Extension Chrome Extension Download from https://pluginsaddonsextensions.com
- Step 2: Now search for the Perforator - Ember Performance Extension in Chrome Webstore Search and click on the search button.
- Step 3: click on the Perforator - Ember Performance Extension Chrome Extension Link
- Step 4: in the next page click on the Add to Chrome button to Download and Install the Perforator - Ember Performance Extension extension for your Chrome Web browser .
Perforator - Ember Performance Extension Chrome extension Download
Looking for a method to Perforator - Ember Performance Extension Download for Chrome then this download link is for you.It is the Perforator - Ember Performance Extension Chrome extension download link you can download and install Chrome Browser.
Download Perforator - Ember Performance Extension chrome extension (CRX)
-
Toggle classes and attributes
-
Developer Tools extension for debugging Backbone.js applications.
-
Performance Toolkit for Chrome Devtools. A visualization of the performance timing.
-
Developer tools for Meteor
-
Get insight into the performance of the website in the current tab - sort of a mini live version of WebPageTest
-
Dev Helper
-
First paint time, page load time, to optimize your webpages
-
This extensions displays some technical and structural performance data of websites.
-
A devtool for Marionette
-
Simple site performance bar that presents network, server, client and pageload times