PerformanceGuard Web Timer Chrome Extension


-
Chrome Extension Page
-
Total Number of Extension users:2K +
-
Reviewed by :0 Chrome Users
-
Author Name:
-
['[email protected]', 'capasystems']
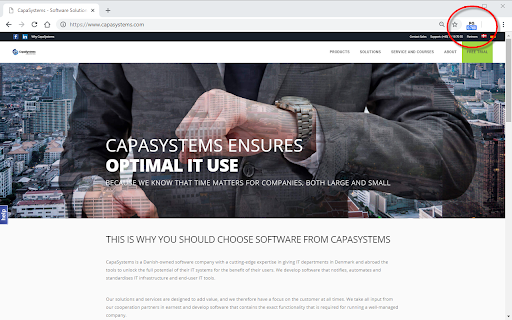
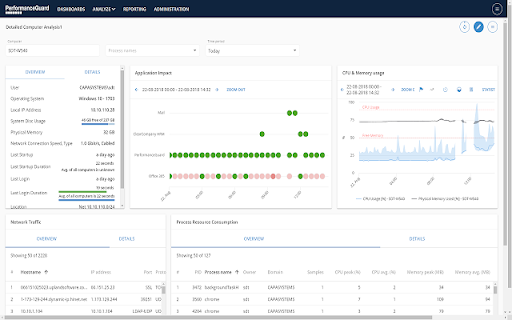
 PerformanceGuard Web Timer does exactly what the name says. The page load time is displayed in your toolbar and with a click, you can see how much time was used to load content and as well as rendering time in the browser. Timings work with regular HTML pages as well as Single Page Applications (SPAs).
When used with the full version of PerformanceGuard, you will be able to consolidate data from all computers in your organization. This allows for alerting and faster troubleshooting on your business applications whether they run on internal servers, hosted or if you are using any cloud services.

How to install PerformanceGuard Web Timer chrome extension in chrome Browser
You can Follow the below Step By Step procedure to install the PerformanceGuard Web Timer Chrome Extension to your Chrome Web browser.
- Step 1: Go to the Chrome webstore https://chrome.google.com/webstore or download the extension PerformanceGuard Web Timer Chrome Extension Download from https://pluginsaddonsextensions.com
- Step 2: Now search for the PerformanceGuard Web Timer in Chrome Webstore Search and click on the search button.
- Step 3: click on the PerformanceGuard Web Timer Chrome Extension Link
- Step 4: in the next page click on the Add to Chrome button to Download and Install the PerformanceGuard Web Timer extension for your Chrome Web browser .
PerformanceGuard Web Timer Chrome extension Download
Looking for a method to PerformanceGuard Web Timer Download for Chrome then this download link is for you.It is the PerformanceGuard Web Timer Chrome extension download link you can download and install Chrome Browser.
Download PerformanceGuard Web Timer chrome extension (CRX)
-
First paint time, page load time, to optimize your webpages
-
Performance Toolkit for Chrome Devtools. A visualization of the performance timing.
-
Get insight into the performance of the website in the current tab - sort of a mini live version of WebPageTest
-
Shows a sitespeed report for the current page you are on. Includes TTFB , redirect time, request time , response time and much more.
-
Displays page load time in the toolbar
-
Simple site performance bar that presents network, server, client and pageload times
-
This extension helps you track your time spent using the web for work.
-
Page Load Times
-
Reports page size, cache usage, network requests, load time.